Eastside single-family July market report: median price drops for the fourth month in a row
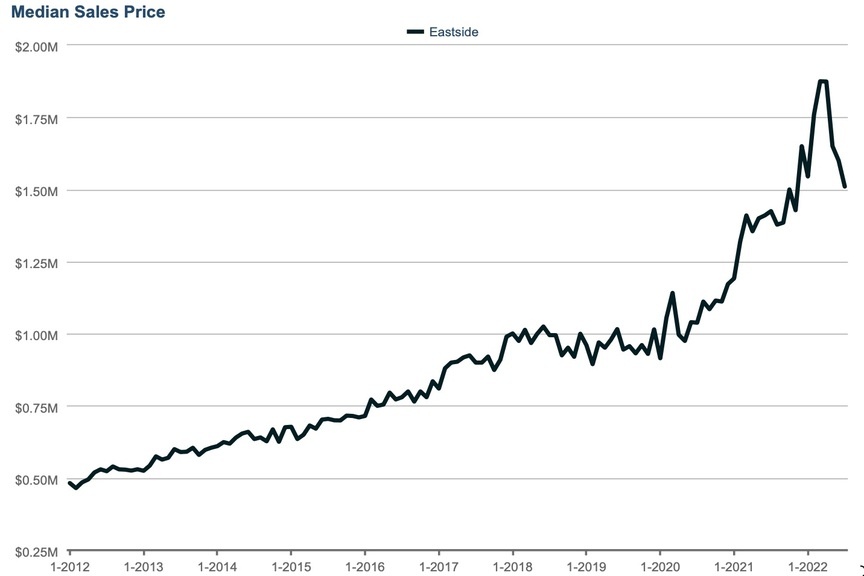
The numbers for how the Eastside single-family and townhome market did in July are out and the headline is again that median sales price dropped for the fourth month in a row, to $1,510,000. The 6% month-over-month drop brings us a lot closer to 2021 prices but we’re still $85,000 above July 2021. Mortgage rates in the 5.5% range continue to be the norm (despite a brief drop below 5%) and buyers still seem to be scarce even though even though pending sales increased in July.
Here’s a deep dive into the rest of the numbers:
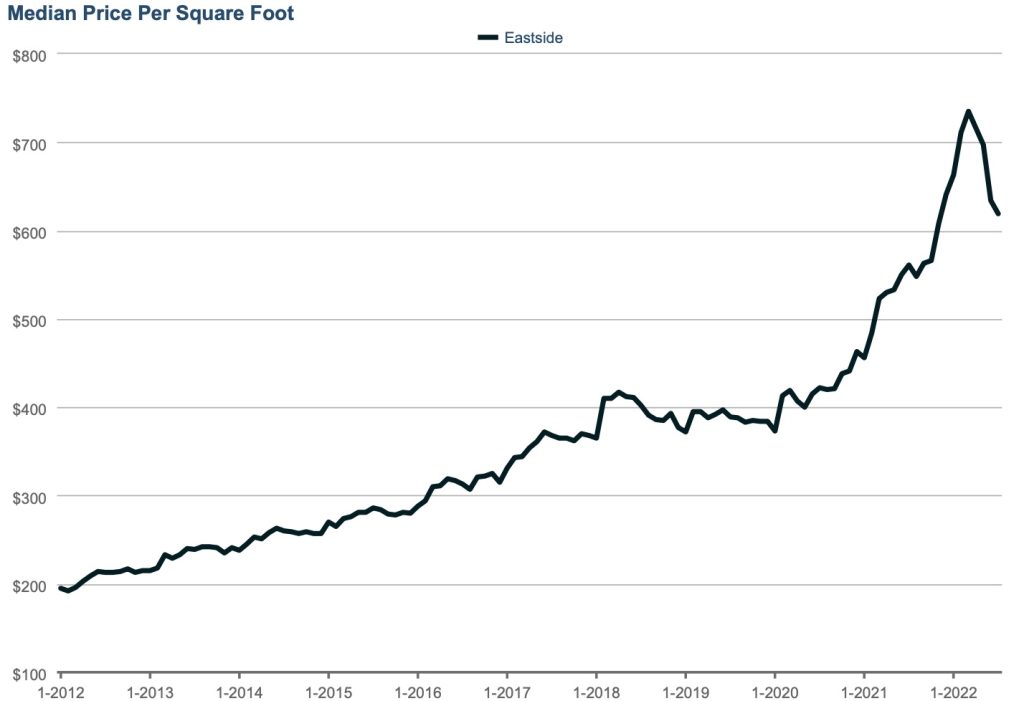
Price per square foot also dropped again this month to $619. This is still up from $561 in July of 2021.
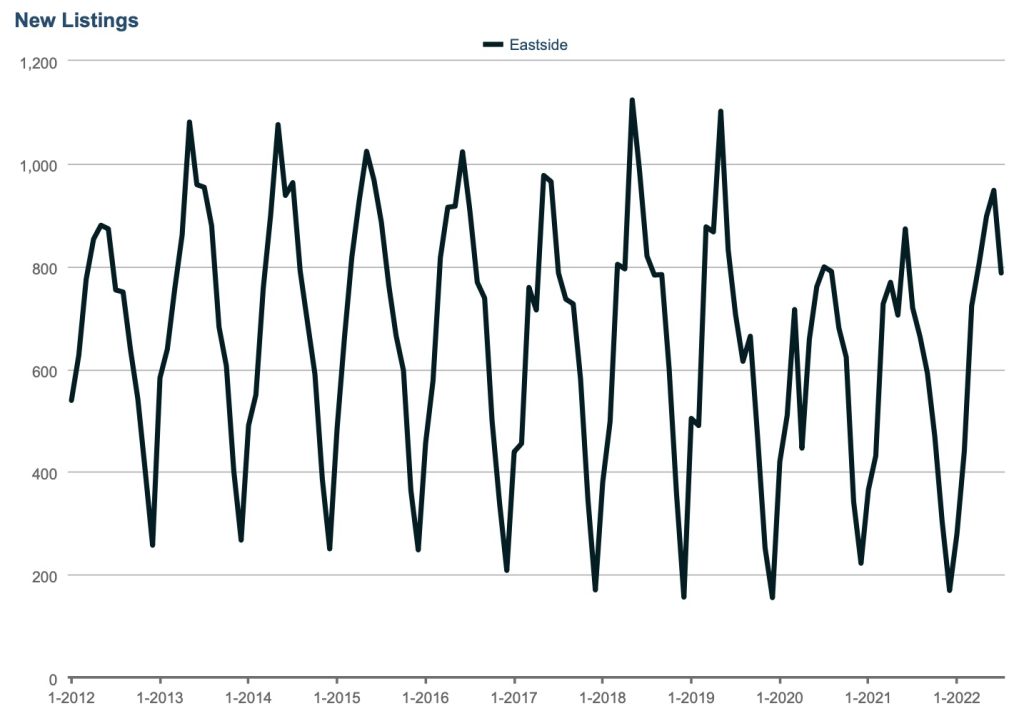
Sellers are also starting to get cautious about the market. New listings dropped 17% in July with just 787 homes coming on the market. This isn’t wholly surprising as May and June are usually the peak months for new listings.
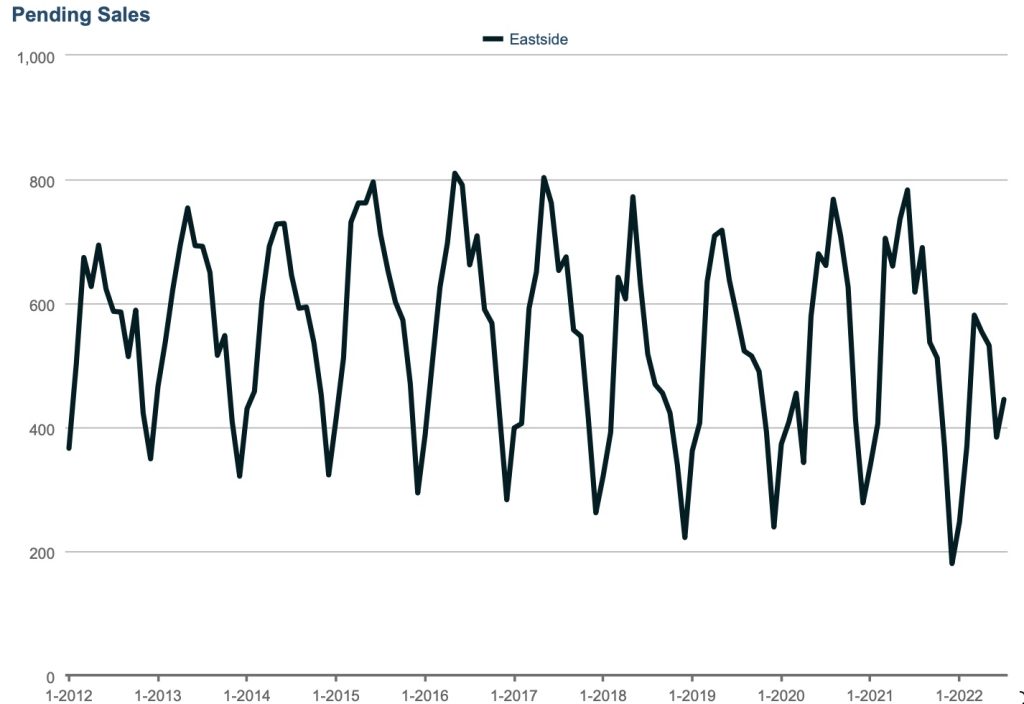
Despite increasing 14% last month, buyers only put 445 homes under contract. It’s a slight sign that buyers are getting used to the higher interest rates but it’s not encouraging for sellers.
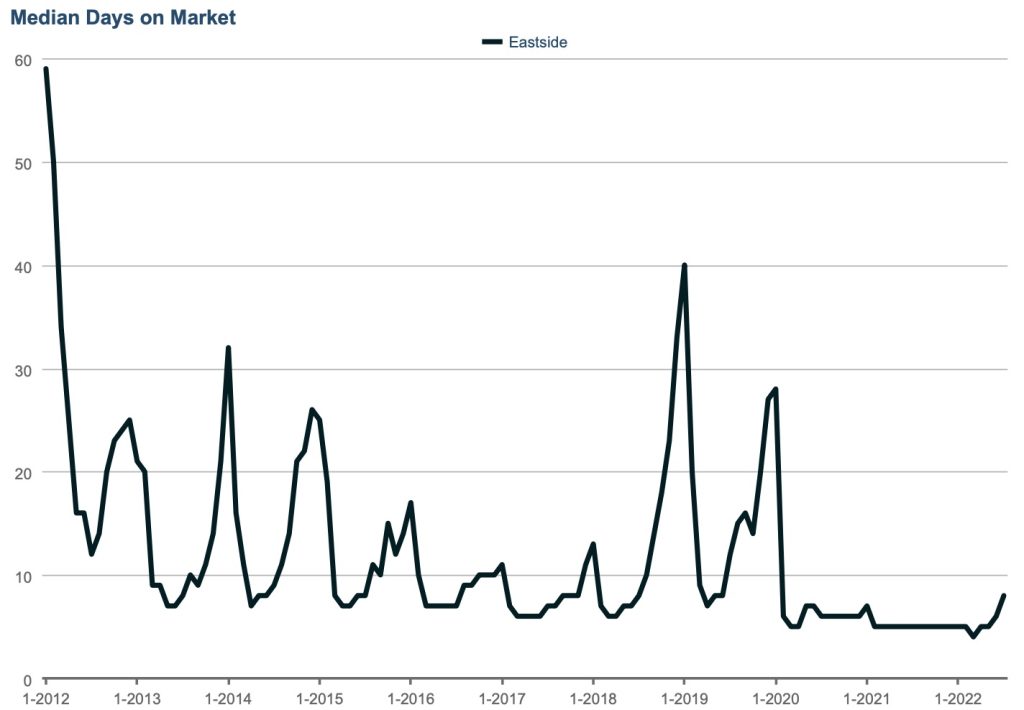
Sellers need to be aware that we are shifting closer and closer to a buyer’s market. If you’re thinking about selling, you’ll want to be pricing your home for the current market conditions as homes are sitting on the market longer. Homes sold in July spent a median of eight days on market before going under contract.
Keep in mind that all of those months of homes at five days on market is forced data based on offer review dates during the hot seller’s market. Offer review deadlines are hard to find right now and, anecdotally, homes going under contract in a couple of days are sellers worried about not getting any offers.
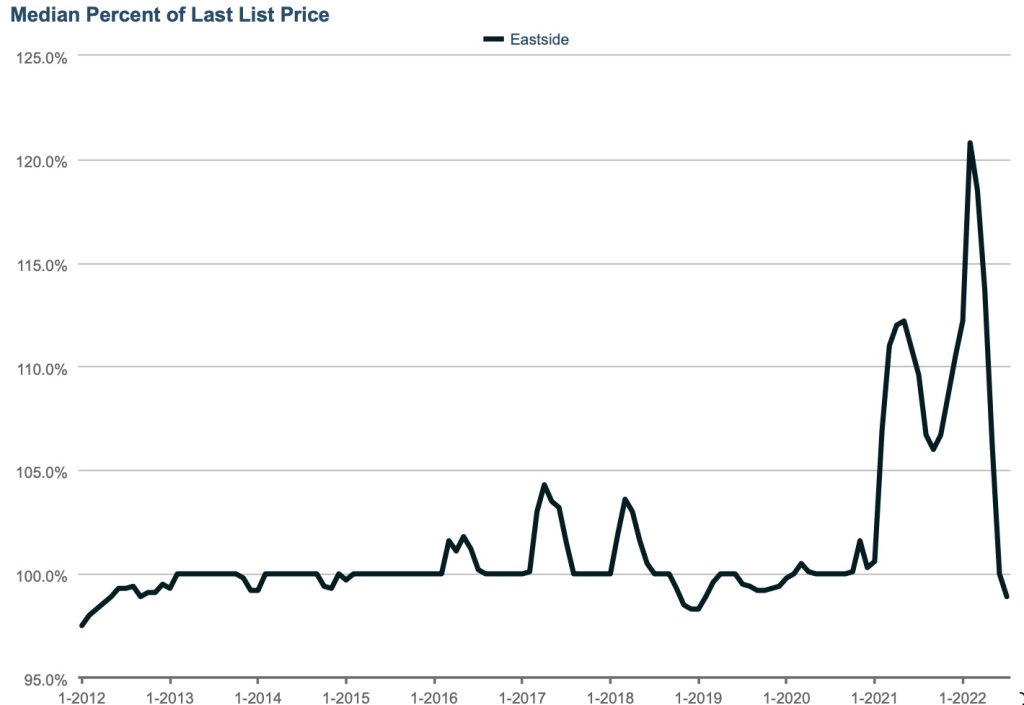
Competition, as measured by the median percent of last list price, has all but disappeared. Percent of last list price dipped below 100% for the first time since 2020. In fact, 98.9% of list price is the lowest level since 2012! Buyers are finding deals right now, either below list or at list with lots of contingencies.
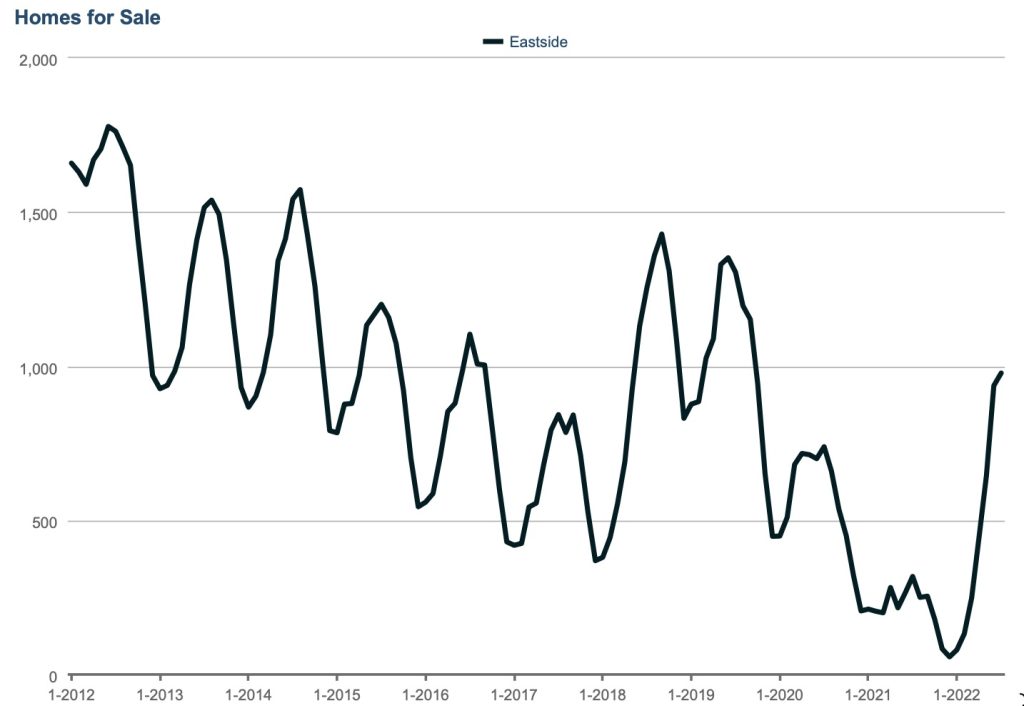
We ended the month with 978 homes still for sale, the highest level since October of 2019. This was more homes than hit the market in July so buyers will continue to have lots of choices.
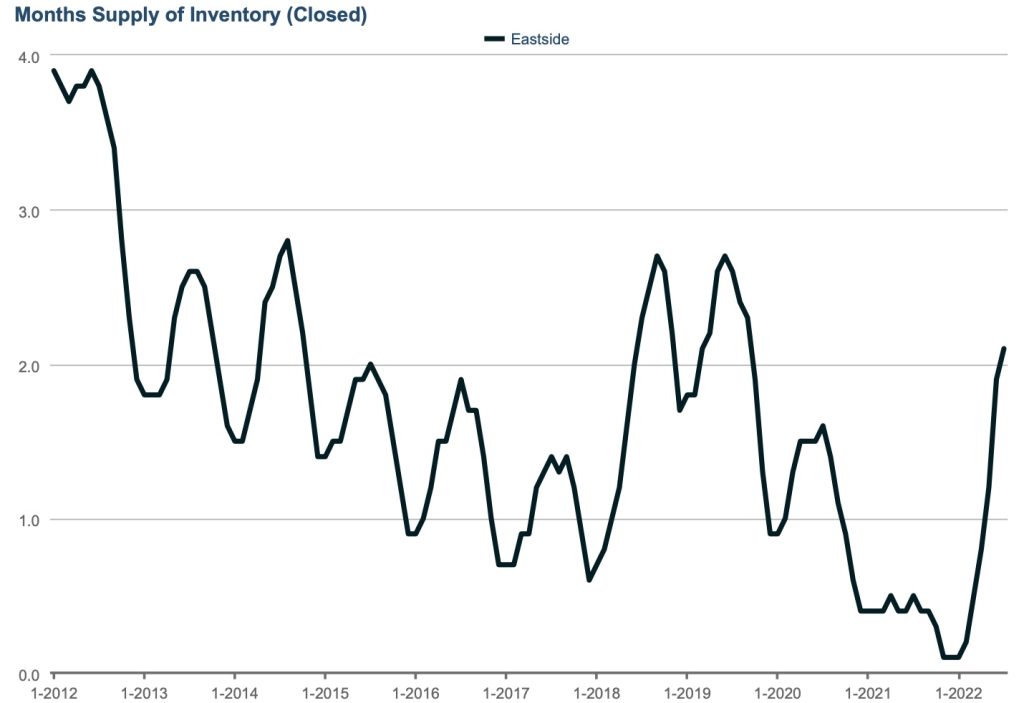
Months supply of inventory, a measure of how long it would take to sell out of the current supply, ticked above two months for the first time since September of 2019. We’re getting closer to a balanced market (generally viewed as three months of inventory) but we’re not quite there.
